The use of composite flours for domestic and industrial applications in baked and confectionery products has being seen as one of the ways for achieving sustainable food and nutrition security especially in developing countries of the world, however, its utilization might be limited by the quality characteristics of the resulting composite flour samples. In this research study, D-optimal design mixture was used to investigate the simultaneous effects of varying compositional percentage of refined wheat flour, soybeans flour and oyster meat powder on some proximate and pasting properties of composite flour. A total of 14 combinations were generated using Design Expert software. The properties of the composite flour measured showed a significantly (p<0.05) influenced on the composite flour samples. The ranges of values for the properties are moisture content - 8.31- 12.25%, fat content - 1.46 - 9.41%, protein content - 11.34 -20.28%; while peak, breakdown and setback viscosities ranges from 418 - 1025cP, 220 - 515cP and 240 - 690cP respectively. The proximate properties of fat and protein contents increased with increase in soybean and oyster meat flour inclusion while moisture content decreased with increase in soybean and oyster meat flour inclusion. The pasting properties of peak, breakdown and setback viscosities were also significantly (p<0.05) affected by varying percentage composition with the properties decreasing with increase in percentage soybean flour and oyster meat powder inclusion. The numerical optimization showed that the best combination of the individual flour were 72.00% refined wheat flour, 20.00% soybeans flour and 8.00% oyster meat powder with a desirability value of 0.719.
| Published in | Journal of Food and Nutrition Sciences (Volume 13, Issue 6) |
| DOI | 10.11648/j.jfns.20251306.12 |
| Page(s) | 314-325 |
| Creative Commons |
This is an Open Access article, distributed under the terms of the Creative Commons Attribution 4.0 International License (http://creativecommons.org/licenses/by/4.0/), which permits unrestricted use, distribution and reproduction in any medium or format, provided the original work is properly cited. |
| Copyright |
Copyright © The Author(s), 2025. Published by Science Publishing Group |
Composite Flour, Proximate Properties, Pasting Properties, Optimization
Code | Parameter | Low level | High level |
|---|---|---|---|
RWF | Refined Wheat Flour | 70 | 100 |
SBF | Soybean Flour | 0 | 22 |
OMP | Oyster Meat Powder | 0 | 8 |
Exp.Run | Sample Code | X1 - RWF | X2 - SBF | X3 - OMP |
|---|---|---|---|---|
1* | RWC1 | 78.00 | 22.00 | 0.00 |
2* | RWC 2 | 100.00 | 0.00 | 0.00 |
3 | RWC 3 | 90.50 | 5.50 | 4.00 |
4 | RWC 4 | 74.00 | 22.00 | 4.00 |
5 | RWC5 | 78.00 | 22.00 | 0.00 |
6 | RWC6 | 89.00 | 11.00 | 0.00 |
7 | RWC7 | 81.00 | 11.00 | 8.00 |
8* | RWC8 | 100.00 | 0.00 | 0.00 |
9 | RWC9 | 70.00 | 22.00 | 8.00 |
10* | RWC10 | 92.00 | 0.00 | 8.00 |
11 | RWC11 | 92.00 | 0.00 | 8.00 |
12 | RWC12 | 100.00 | 0.00 | 8.00 |
13 | RWC13 | 92.50 | 5.50 | 2.00 |
14 | RWC14 | 74.00 | 22.00 | 4.00 |
Runs | Variables | Responses | |||||||
|---|---|---|---|---|---|---|---|---|---|
Codes | X1 | X2 | X3 | Y1 | Y2 | Y3 | Y4 | Y5 | Y6 |
RWC1 | 78.00 | 22.00 | 0.00 | 9.80 | 7.96 | 16.87 | 570 | 310 | 280 |
RWC2 | 100.00 | 0.00 | 0.00 | 12.20 | 1.44 | 11.48 | 1020 | 510 | 690 |
RWC3 | 90.50 | 5.50 | 4.00 | 10.83 | 5.53 | 14.19 | 670 | 410 | 430 |
RWC4 | 74.00 | 22.00 | 4.00 | 9.14 | 8.62 | 18.60 | 460 | 260 | 240 |
RWC5 | 81.50 | 16.50 | 2.00 | 10.01 | 7.39 | 17.68 | 580 | 350 | 330 |
RWC6 | 70.00 | 22.00 | 8.00 | 8.31 | 9.38 | 20.28 | 420 | 222 | 242 |
RWC7 | 92.00 | 0.00 | 8.00 | 11.30 | 4.42 | 14.99 | 747 | 440 | 450 |
RWC8 | 100.00 | 0.00 | 0.00 | 12.25 | 1.46 | 11.34 | 1025 | 515 | 680 |
RWC9 | 92.00 | 0.00 | 8.00 | 11.39 | 4.40 | 14.95 | 740 | 430 | 450 |
RWC10 | 78.00 | 22.00 | 0.00 | 9.91 | 7.99 | 16.83 | 560 | 310 | 280 |
RWC11 | 85.00 | 11.00 | 4.00 | 10.54 | 6.14 | 15.94 | 660 | 390 | 380 |
RWC12 | 89.00 | 11.00 | 0.00 | 10.70 | 5.31 | 15.50 | 550 | 300 | 275 |
RWC13 | 77.50 | 16.50 | 6.00 | 9.60 | 7.31 | 17.74 | 550 | 300 | 275 |
RWC14 | 70.00 | 22.00 | 8.00 | 8.40 | 9.41 | 20.15 | 418 | 220 | 240 |
Source | Moisture a (%) | Fat a (%) | Protein a (%) | Peak Viscosity b (cP) | Breakdown Viscosity b (cP) | Setback Viscosity b (cP) |
|---|---|---|---|---|---|---|
Model (SS) | 20.000 | 86.64 | 96.22 | 4.765E+005 | 1.217E+005 | 3.007E+005 |
Linear Mixture (SS) | 19.94* | 84.65* | 94.27* | 4.114E+005* | 1.103E+005* | 2.454E+005* |
AB (SS) | 0.046 | 0.28 | 1.09 | 3820.69* | 756.93* | 1722.23* |
AC (SS) | 0.016 | 0.018 | 0.47 | 3909.46* | 1160.11* | 2036.59* |
BC (SS) | 1.131E-003 | 4.349E-004 | 0.40 | 3761.02* | 1098.80* | 1899.76* |
ABC (SS) | 3899.93* | 1157.31* | 2013.24* | |||
AB (A-B) | 1102.55* | 208.74* | 289.61* | |||
AC (A-C) | 4138.85* | 1361.01* | 2413.58* | |||
BC (B-C) | 3588.41* | 1092.83* | 1889.88* | |||
Model F-Value | 177.66* | 118.66* | 75.29* | 2379.34* | 838.75* | 2570.15* |
Lack of Fit F-Value | 11.73* | 1061.10* | 202.48* | - | - | - |
p-Value (Prob>F) | < 0.0001* | < 0.0001* | < 0.0001* | < 0.0001* | < 0.0001* | < 0.0001* |
Std Dev | 0.15 | 0.38 | 0.51 | 4.72 | 4.02 | 3.61 |
Responses | Regression Model (Final Equation in Terms of Pseudo Component) | Type of Model | R2 | Adj. R2 | Adeq Precision |
|---|---|---|---|---|---|
Moisture Content | 12.20*A+9.32*B+4.86*C-1.33*A*B+5.63*A*C+1.40*B* C | Quadratic | 0.9911 | 0.9855 | 38.674 |
Fat Content | 1.58*A+9.43*B+7.95*C+3.28*A*B+5.99*A*C+0.87*B*C | Quadratic | 0.9867 | 0.9784 | 30.496 |
Protein Content | 11.38*A+17.58*B+46.65*C+6.46*A*B-30.45*A*C-26.30*B*C | Quadratic | 0.9779 | 0.9662 | 26.617 |
Peak Viscosity | 1022.50*A+1748.88*B+1.314E+005*C-3865.91*A*B-2.196E+005*A*C-2.251E +005*B*C+2.107E+005*A*B*C+2566.12*A*B*(A-B)+86642.58*A*C*(A-C)+ 88964.63 *B*C*(B-C) | Cubic | 0.9998 | 0.9994 | 151.383 |
Breakdown Viscosity | 512.50*A+834.17*B+70959.61*C-1720.72*A*B-1.196E+005*A*C-1.217E +005 *B*C+1.148E+005*A*B*C+1116.55*A*B*(A-B)+49684.57*A*C*(A-C)+ 49095.66*B*C*(B-C) | Cubic | 0.9995 | 0.9993 | 85.892 |
Setback Viscosity | 685.00*A+988.53*B+93413.75*C-2595.53*A*B-1.585E+005*A*C-1.600E+ 005 *B*C+1.514E+005*A*B*C+1315.18*A*B*(A-B)+66164.06*A*C*(A-C)+ 64562.99*B* C*(B-C) | Cubic | 0.9998 | 0.9994 | 146.033 |
Categories | Goal | Lower Limit | Upper Limit | Lower Weight | Upper Weight | Importance |
|---|---|---|---|---|---|---|
Refined Wheat Flour | is in range | 70 | 100 | 1 | 1 | 3 |
Soybeans Flour | is in range | 0 | 22 | 1 | 1 | 3 |
Oyster Meat Powder | is in range | 0 | 8 | 1 | 1 | 3 |
Moisture Content | Minimize | 8.31 | 12.25 | 1 | 1 | 3 |
Fat Content | Maximize | 1.46 | 9.41 | 1 | 1 | 3 |
Protein Content | Maximize | 11.34 | 20.28 | 1 | 1 | 3 |
Peak Viscosity | Maximize | 418 | 1025 | 1 | 1 | 3 |
Breakdown Viscosity | Minimize | 220 | 515 | 1 | 1 | 3 |
Setback Viscosity | Minimize | 240 | 690 | 1 | 1 | 3 |
No | Refined Wheat Flour (%) | Soybean Flour (%) | Oyster Meat Powder (%) | Moisture Content (%) | Fat Content (%) | Protein Content (%) | Peak Viscosity (cP) | Breakdown Viscosity (cP) | Setback Viscosity (cP) | Desirability | |
|---|---|---|---|---|---|---|---|---|---|---|---|
1 | 72.00 | 20.00 | 8.00 | 8.608 | 8.922 | 19.989 | 623.773 | 323.592 | 354.101 | 0.719 | Selected |
2 | 75.45 | 22.00 | 2.55 | 9.391 | 8.533 | 17.794 | 581.491 | 329.478 | 323.015 | 0.633 | |
3 | 77.73 | 22.00 | 0.27 | 9.788 | 8.036 | 17.222 | 606.036 | 314.313 | 314.313 | 0.614 |
RWF | Refined Wheat Flour |
SBF | Soybean Flour |
OMP | Oyster Meat Powder |
| [1] | Shittu, T., Raji, A. O. and Sanni, L. O. (2007). Bread from composite cassava-wheat flour: I. Effect of baking time and temperature on some physical properties of bread loaf. Food Research International 40: 280-290. |
| [2] | Noorfarahzilah, M., Lee, J. S., Sharifudin, M. S., Mohd-Fadzelly, A. B. and Hasmadi, M. (2014). Applications of composite flour in development of food products - MiniReview. International Food Research Journal 21(6): 2061-2074. |
| [3] | Ajatta, M. A., Akinola, S. A. and Osundahunsi, O. F. (2016). Proximate, Functional and Pasting Properties of Composite Flours Made from Wheat, Breadfruit and Cassava Starch. Applied Tropical Agriculture Volume 21, No. 3, 158-165. |
| [4] | Hasmadi, M., Noorfarahzilah, M., Noraidah, H., Zainol, M. K. and Jahurul, M. H. A. (2020). Functional properties of composite flour: A Review. Food Research 4 (6): 1820-1831. |
| [5] | Morens C., Bos C., Pueyo M. E., Benamouzig R., Gausseres N., Luengo C., Tome D. and Gaudichon C. (2003). Increasing habitual protein intake accentuates differences in postprandial dietary nitrogen utilization between protein sources in humans, Journal of Nutrition, 133: (9), 2733-2740. |
| [6] | Dewettinck, K., Van Bockstaele, F., Kuhne, B., Van De Walle, D., Courtens, T. M. and Gellynck X. (2008). Nutritional value of bread: Influence of processing, food interaction and consumer perception, Journal of Cereal Science, 48: 243-257. |
| [7] | Jideani, V. and Onwubali, F. (2009). Optimization of wheat-sprouted soybean flour bread using response surface methodology, African Journal of Biotechnology, 8(22): 6364-6373. |
| [8] | Hall, R. D., Wilde, P. J. and Fisk, I. D. (2020). Advances in food protein research and applications. Critical Reviews in Food Science and Nutrition, 60(14), 2371-2395. |
| [9] | Akinwotu, K. O., Taiwo, K. A. and Ikujenlola, A. V. (2025). Advancements in Composite Flours: Applications, Nutritional Benefits and Processing Techniques. Asian Food Science Journal, 24 (6): 24-36. |
| [10] | Wang, W., Jones, O. G. and Singh, A. (2019). Amino acid profiles and protein quality of major plant proteins. Journal of Food Science, 84(3), 655-664. |
| [11] | Yanni, A. E., Iakovidi, S., Vasilikopoulou, E. and Karathanos, V. T. (2023). Legumes: A vehicle for transition to sustainability. Nutrients, 16(1), p. 98. |
| [12] | Khan, M. I., Kumar, S. and Singh, S. P. (2021). Nutritional and functional properties of soybean and its utilization in bakery products: A review. Food Chemistry, 360, 129938. |
| [13] | Patel, S., Singh, G. and Kalia, K. (2020). Health benefits of soy isoflavones in cancer prevention and cardiovascular diseases. Nutrition Reviews, 78(11), 895-907. |
| [14] | FAO, (2019). Legumes: Nutritional value and their role in human health. Food and Agriculture Organization of the United Nations. |
| [15] | Wu, G. and Flynn, N. E. (2020). Strategies to improve protein quality in plant-based complementary foods. Annual Review of Nutrition, 40, 165-188. |
| [16] | Orunaboka, W. T., Kosoko, S. B., Wabali, V. C. and Olokoshe, A. A. (2023). Optimization Method of Whole Wheat Flour, Soybean Flour, Oyster Meat Powder for Nutrient-Dense Composite Flour. European Journal of Nutrition & Food Safety Vol. 15 (7), Pg 1-13. |
| [17] | Aimutis, W. R. (2022). Plant-based proteins: the good, bad, and ugly. Annual review of food science and technology, 13(1), pp. 1-17. |
| [18] | Sharma, P., Goyal, P. and Kumar, A. (2021). Quality and nutritional improvement of wheat-based products using leguminous flours: A review. International Journal of Food Science and Technology, 56(6), 2870-2881. |
| [19] | Nguyen, H. M., Ho, H. L., Babel, M. S., Tangdamrongsub, N., Himanshu, S. K., Hamel, P. and Park, E. (2024). Nature-based solutions for improving food security: A systematic global review. Heliyon, 10(16). |
| [20] | Obande, R. A., Omeji, S. and Isiguzo, L. (2013). Proximate composition and mineral content of the Fresh water snail (Pila ampullacea) from River Benue, Nigeria. Journal of Environmental Science, Toxicology and Food Technology, 2 (6), 43-46. |
| [21] | Kiin-Kabari, D. B., Hart A. D. and Nyeche P. T. (2017). Nutrient Composition of selected Shell Fish Consumed in Rivers State, Nigeria. American Journal of Food and Nutrition, 5, 4, 142- 146. |
| [22] | Ndife, J., Abdulraheem, L. O. and Zakari, U. M. (2011). Evaluation of the nutritional and sensory quality of functional breads produced from whole wheat and soya bean flour blends. African Journal Food Science 58: 466-472. |
| [23] | AOAC, (2010). Official Method of Analysis of Association Official Analytical Chemists. 18th Edition, Washington DC, 2010, pp. 114-320. |
| [24] | Falade, K. O. and Olugbuyi, A. O. (2010). Effects of maturity and drying method on the physicochemical and reconstitution properties of plantain flour. International Journal of Food Science and Technology, 45(1), 170-178. |
| [25] | Cornell J.A (2002). Experiment with mixtures, designs, models and the analysis of mixture data, 3rd edition, John Wiley & Sons, Inc., USA. |
| [26] | Jideani, V. A. (2011). Functional properties of soybean food ingredients in food systems. Soybean-Biochemistry, chemistry and physiology, 345-366. |
| [27] | Akubor, P. I. and Fayashe, T. O. (2018). Chemical composition, functional properties and performance of soybean and wheat flour blends in instant fried noodles. South Asian Journal of Food Technology and Environment, 4(2), 690-699. |
| [28] | Obomeghei, A.A., Olapade, A.A. and Akinoso, R. (2020). Evaluation of the chemical composition, functional and pasting properties of four varieties of Nigerian sweet potato [Ipomoea batatas L. (Lam.)] flour. Afr. J. Food Agric. Nutr. Dev; 20(3): 15764-15778. |
| [29] | Aluge, O. O., Akinola, S. A. and Osundahunsi, O. F. (2016). Effect of Malted Sorghum on Quality Characteristics of Wheat-Sorghum-Soybean Flour for Potential Use in Confectionaries. Food and Nutrition Sciences, 7: 1241-1252. |
| [30] | Bodor, K., Szilágyi, J., Salamon, B., Szakács, O. and Bodor, Z. (2024). Physical-chemical analysis of different types of flours available in the Romanian market. Sci. pp, 14, 881. |
| [31] | Ikegwu, T.M., Ikediashi, B.A, Okolo, C.A. and Ezembu, E.N. (2021). Effect of some processing methods on the chemical and functional properties of complementary foods from millet-soybean flour blends. Cogent Food & Agriculture. 7: Pp 1-14. 1918391 |
| [32] | Ayo, J. A., Ayo, V. A., Popoola, C., Omosebi, M., and Joseph, L. (2014). Production and evaluation of malted soybean-acha composite flour bread & biscuit. African Journal of Food Science and Technology, 5(1), 21-28. |
| [33] | Wang, T. (2002). 2 Soybean oil. Vegetable oils in food technology: Composition, properties and uses, pp. 18-52. Edt. F. D. Gunstone. Blackwell Publishing CRC. |
| [34] | Dilawari, R., Kaur, N., Priyadarshi, N., Prakash, I., Patra, A., Mehta, S., Singh, B., Jain, P. and Islam, M. A. (2022). Soybean: A key player for global food security. In Soybean improvement: physiological, molecular and genetic perspectives (pp. 1-46). Cham: Springer International Publishing. |
| [35] | Shahidi, F. and Hossain, A. (2022). Role of lipids in food flavor generation. Molecules, 27(15), p. 5014. |
| [36] | Garg, S., Malik, R. K., Lule, V. and Awasti, N. (2014). Soy and its supplements in combating malnutrition and lifestyle disorders. Journal of Innovative Biology, 1(3), 126-131. |
| [37] | Ouazib, M., Dura, A., Zaidi, F. and Rosell, C. M. (2016). Effect of partial substitution of wheat flour by processed (germinated, toasted, cooked) chickpea on bread quality. Int. J. Agric. Sci. Technol., 11, 1. |
| [38] | Omoba, O. S., Awolu, O. O. Olagunju, A. I. and Akomolafe, A. O. (2013). Optimisation of Plantain - Brewers’ Spent Grain Biscuit Using Response Surface Methodology. Journal of Scientific Research and Reports, 2(2), 665-681. |
| [39] | Awolu, O. O., Osemeke, R. O. and Ifesan, B. O. T. (2016). Antioxidant, functional and rheological properties of optimized composite flour, consisting wheat and amaranth seed, brewers’ spent grain and apple pomace. Journal of Food Science and Technology, 53(2), 1151-1163. |
| [40] | Kumar, P., Yadava, R. K., Gollen, B., Kumar, S., Verma, R. K. and Yadav, S. (2011). Nutritional contents and medicinal properties of wheat: a review. Life Sciences and Medicine Research, 22(1), pp. 1-10. |
| [41] | Adebayo-Oyetoro, A. O., Ogundipe, O. O. and Nojeemdeen, K. (2016). Quality assessment and consumer acceptability of bread from wheat and fermented banana flour. Food Science & Nutrition, 4(3), 364 - 369. |
| [42] | Maziya-Dixon, B., Dixon, A. G. O., and Adebowale, A. A. (2007). Targeting different end uses of cassava: genotypic variations for cyanogenic potentials and pasting properties. International Journal of Food Science and Technology 2007, 42, 969-976. |
| [43] | Khalil AH, Mansour EH, Dawoud FM (2000). Influence of Malt on Rheological and Baking Properties of Wheat-cassava Composite Flours. Lebensm.-Wiss. u.-Technol. 33: 159-164. |
| [44] | Patindola, J., Wanga, Y. and Jane J. (2005). Structure- Functionality Changes in Starch Following Rough Rice Storage. Starch/Stärke 57, 197-207. Peroni, F. H. G., Rocha, T. S. and Franco. |
| [45] | Akanbi, C. T, Nazamid, S. and Adebowale, A. A. (2009). Functional and pasting properties of a tropical breadfruit (Artocarpus altilis) starch from Ile-Ife, Osun State, Nigeria, International Food Research Journal, 16: 151-157. |
| [46] | Sanni, L. O, Adebowale, A. A., Filani, T. A., Oyewol, O. B. and Westby, A. (2006). Quality of flash and rotary dried flour. Journal of Food Agriculture and Environment, 4 (3& 4): 74-78. |
APA Style
Orunaboka, W. T., Kosoko, S. B. (2025). Use of D-Optimal Mixture Design in Optimizing the Quality Characteristics of Refined Wheat-Soybean-Oyster Meat Powder Composite Flour. Journal of Food and Nutrition Sciences, 13(6), 314-325. https://doi.org/10.11648/j.jfns.20251306.12
ACS Style
Orunaboka, W. T.; Kosoko, S. B. Use of D-Optimal Mixture Design in Optimizing the Quality Characteristics of Refined Wheat-Soybean-Oyster Meat Powder Composite Flour. J. Food Nutr. Sci. 2025, 13(6), 314-325. doi: 10.11648/j.jfns.20251306.12
AMA Style
Orunaboka WT, Kosoko SB. Use of D-Optimal Mixture Design in Optimizing the Quality Characteristics of Refined Wheat-Soybean-Oyster Meat Powder Composite Flour. J Food Nutr Sci. 2025;13(6):314-325. doi: 10.11648/j.jfns.20251306.12
@article{10.11648/j.jfns.20251306.12,
  author = {Wilson Tamunotonye Orunaboka and Sulaimon Babatunde Kosoko},
  title = {Use of D-Optimal Mixture Design in Optimizing the Quality Characteristics of Refined Wheat-Soybean-Oyster Meat Powder Composite Flour
},
  journal = {Journal of Food and Nutrition Sciences},
  volume = {13},
  number = {6},
  pages = {314-325},
  doi = {10.11648/j.jfns.20251306.12},
  url = {https://doi.org/10.11648/j.jfns.20251306.12},
  eprint = {https://article.sciencepublishinggroup.com/pdf/10.11648.j.jfns.20251306.12},
  abstract = {The use of composite flours for domestic and industrial applications in baked and confectionery products has being seen as one of the ways for achieving sustainable food and nutrition security especially in developing countries of the world, however, its utilization might be limited by the quality characteristics of the resulting composite flour samples. In this research study, D-optimal design mixture was used to investigate the simultaneous effects of varying compositional percentage of refined wheat flour, soybeans flour and oyster meat powder on some proximate and pasting properties of composite flour. A total of 14 combinations were generated using Design Expert software. The properties of the composite flour measured showed a significantly (pp<0.05) affected by varying percentage composition with the properties decreasing with increase in percentage soybean flour and oyster meat powder inclusion. The numerical optimization showed that the best combination of the individual flour were 72.00% refined wheat flour, 20.00% soybeans flour and 8.00% oyster meat powder with a desirability value of 0.719.
},
 year = {2025}
}
TY  - JOUR
T1  - Use of D-Optimal Mixture Design in Optimizing the Quality Characteristics of Refined Wheat-Soybean-Oyster Meat Powder Composite Flour

AU  - Wilson Tamunotonye Orunaboka
AU  - Sulaimon Babatunde Kosoko
Y1  - 2025/11/26
PY  - 2025
N1  - https://doi.org/10.11648/j.jfns.20251306.12
DO  - 10.11648/j.jfns.20251306.12
T2  - Journal of Food and Nutrition Sciences
JF  - Journal of Food and Nutrition Sciences
JO  - Journal of Food and Nutrition Sciences
SP  - 314
EP  - 325
PB  - Science Publishing Group
SN  - 2330-7293
UR  - https://doi.org/10.11648/j.jfns.20251306.12
AB  - The use of composite flours for domestic and industrial applications in baked and confectionery products has being seen as one of the ways for achieving sustainable food and nutrition security especially in developing countries of the world, however, its utilization might be limited by the quality characteristics of the resulting composite flour samples. In this research study, D-optimal design mixture was used to investigate the simultaneous effects of varying compositional percentage of refined wheat flour, soybeans flour and oyster meat powder on some proximate and pasting properties of composite flour. A total of 14 combinations were generated using Design Expert software. The properties of the composite flour measured showed a significantly (pp<0.05) affected by varying percentage composition with the properties decreasing with increase in percentage soybean flour and oyster meat powder inclusion. The numerical optimization showed that the best combination of the individual flour were 72.00% refined wheat flour, 20.00% soybeans flour and 8.00% oyster meat powder with a desirability value of 0.719.

VL  - 13
IS  - 6
ER  -
Food Nutrition and Home Science Department, University of Port Harcourt Choba, Port Harcourt, Nigeria
Food Technology Department, Federal Institute of Industrial Research Oshodi, Lagos, Nigeria
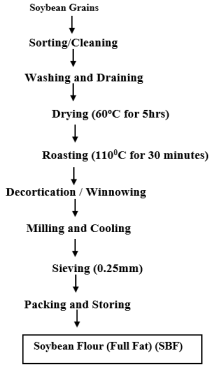
Figure 1. Preparation of Soybean Flour (SBF).
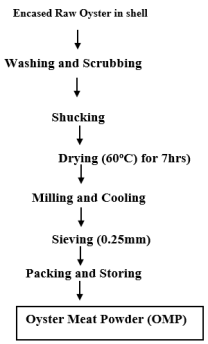
Figure 2. Preparation of Oyster Meat Powder (OMP).
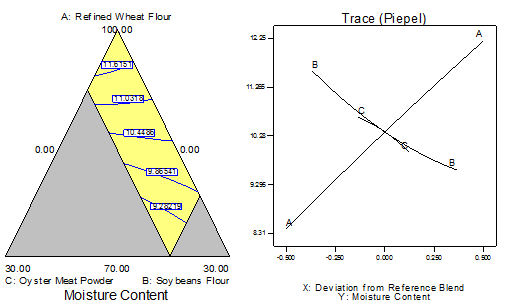
Figure 3. Contour plots and Trace plot curves of variation in composite (A: Refined wheat, B: Soybeans, C: Oyster meat powder) flour on the moisture content composite flour.
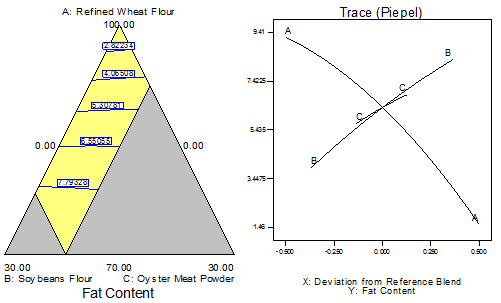
Figure 4. Contour plots and Trace plot curves of variation in composite (A: Refined wheat, B: Soybeans, C: Oyster meat powder) flour on the fat content of composite flour.
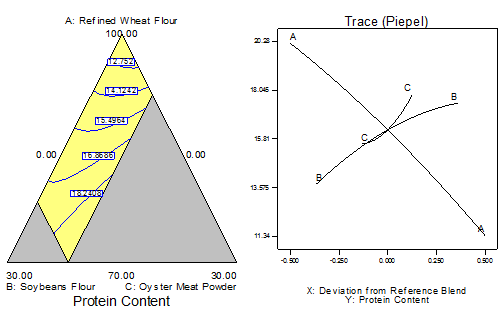
Figure 5. Contour plots and Trace plot curves of variation in composite (A: Refined wheat, B: Soybeans, C: Oyster meat powder) flour on the protein content of composite flour.
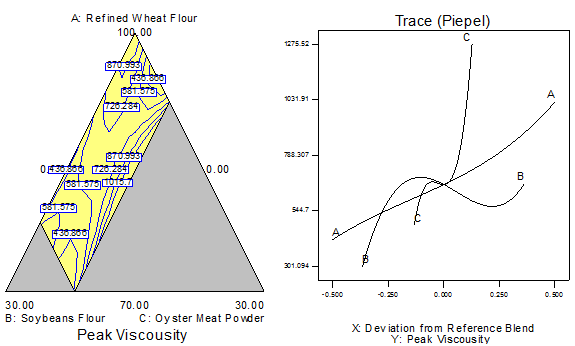
Figure 6. Contour plots and Trace plot curves of variation in composite (A: Refined wheat, B: Soybeans, C: Oyster meat powder) flour on the Peak viscosity of composite flour.
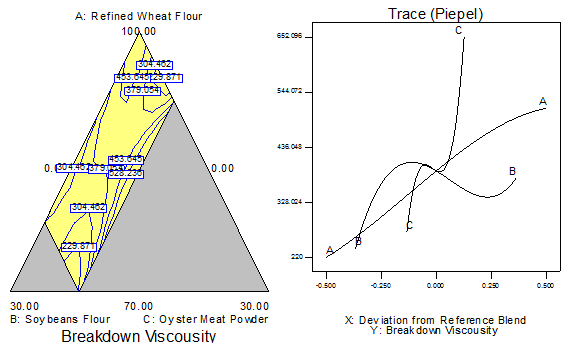
Figure 7. Contour plots and Trace plot curves of variation in composite (A: Refined wheat, B: Soybeans, C: Oyster meat powder) flour on the Breakdown viscosity of composite flour.
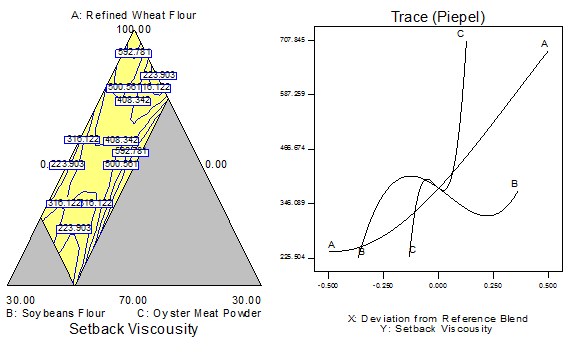
Figure 8. Contour plots and Trace plot curves of variation in composite (A: Refined wheat, B: Soybeans, C: Oyster meat powder) flour on the Setback Viscosity of composite flour.
Information