This study optimized microwave assisted aqueous extraction of phytochemicals from Syzygium cumini leaf powder using water as solvent. Response surface methodology with a three factor Box Behnken design was used to quantify the effects of microwave power, extraction time, and particle size. Factor ranges were 360 - 900 W, 8 - 20 min, and 100 - 500 µm. Microwave irradiation was applied in pulsed mode to limit boiling. Process performance was evaluated using total phenolic content, total flavonoid content, total tannin content, and antioxidant activity measured by DPPH and ABTS assays. Numerical optimization predicted an optimum at 900 W, 18.94 min, and 276.54 µm. At these conditions, predicted responses were 305.44 mg GAE/g ds for total phenolics, 70.12 mg RE/g ds for total flavonoids, and 83.35 mg TAE/g ds for total tannins. Predicted antioxidant activities were 5.51 mM TE/g ds for DPPH and 5.78 mM TE/g ds for ABTS. Experimental validation was conducted at the nearest practical settings of 900 W, 20 min, and 273 µm. Measured values were 305.55 ± 0.07 mg GAE/g ds, 70.54 ± 0.05 mg RE/g ds, and 81.99 ± 0.03 mg TAE/g ds for total phenolics, total flavonoids, and total tannins, respectively. DPPH and ABTS reached 5.47 ± 0.03 and 5.74 ± 0.04 mM TE/g ds, respectively. The close agreement between predicted and measured responses supports the use of RSM to define an implementable operating window for aqueous microwave extraction of Syzygium cumini leaves.
| Published in | Journal of Food and Nutrition Sciences (Volume 14, Issue 1) |
| DOI | 10.11648/j.jfns.20261401.15 |
| Page(s) | 53-67 |
| Creative Commons |
This is an Open Access article, distributed under the terms of the Creative Commons Attribution 4.0 International License (http://creativecommons.org/licenses/by/4.0/), which permits unrestricted use, distribution and reproduction in any medium or format, provided the original work is properly cited. |
| Copyright |
Copyright © The Author(s), 2026. Published by Science Publishing Group |
Response Surface Methodology, Bioactive Compounds, Plant Extract Processing, Phenolic Compounds, Radical Scavenging Activity
Independent variables | Symbols | Coded levels | ||
|---|---|---|---|---|
-1 | 0 | 1 | ||
MP | 360 | 630 | 900 | |
ET | 8 | 14 | 20 | |
PS | 100 | 300 | 500 | |
Runs | Independent variables | Responses | ||||||
|---|---|---|---|---|---|---|---|---|
MP (W) | ET (min) | PS (µm) | Phytochemicals | Antioxidant activities | ||||
TPC (mg GAE/g ds) | TFC (mg RE/g ds) | TTC (mg TAE/g ds) | DPPH (mM TE/g ds) | ABTS (mM TE/g ds) | ||||
1 | 630 | 20 | 100 | 279.01 | 65.00 | 78.43 | 4.93 | 5.03 |
2 | 360 | 14 | 100 | 261.77 | 59.05 | 80.14 | 4.77 | 4.69 |
3 | 360 | 14 | 500 | 230.22 | 40.82 | 64.76 | 3.72 | 4.09 |
4 | 630 | 20 | 500 | 270.54 | 55.87 | 70.01 | 4.27 | 5.16 |
5a | 630 | 14 | 300 | 283.25 | 61.06 | 78.69 | 5.01 | 5.61 |
6 | 900 | 14 | 100 | 297.63 | 64.74 | 83.35 | 5.23 | 5.41 |
7 | 900 | 14 | 500 | 275.20 | 63.97 | 83.15 | 4.96 | 5.21 |
8a | 630 | 14 | 300 | 281.38 | 62.06 | 81.36 | 4.96 | 5.41 |
9 | 360 | 8 | 300 | 238.14 | 49.79 | 67.73 | 4.18 | 4.23 |
10a | 630 | 14 | 300 | 282.33 | 62.03 | 79.57 | 4.99 | 5.56 |
11 | 360 | 20 | 300 | 243.82 | 49.48 | 73.89 | 4.15 | 4.31 |
12 | 900 | 20 | 300 | 304.78 | 70.38 | 81.50 | 5.42 | 5.72 |
13 | 900 | 8 | 300 | 261.38 | 53.87 | 77.34 | 4.60 | 4.62 |
14 | 630 | 8 | 100 | 262.52 | 56.87 | 73.25 | 4.32 | 4.92 |
15 | 630 | 8 | 500 | 233.89 | 50.48 | 65.53 | 3.81 | 3.88 |
Source | Model p-value | Lack of Fit p-value | Adjusted R² | Predicted R² | Remarks |
|---|---|---|---|---|---|
TPC | |||||
Linear | 0.0004 | 0.0054 | 0.7442 | 0.6664 | |
2FI | 0.3345 | 0.0054 | 0.7646 | 0.6905 | |
Quadratic | 0.0007 | 0.0635 | 0.9841 | 0.9125 | Suggested |
Cubic | 0.0635 | 0.9983 | Aliased | ||
TFC | |||||
Linear | 0.0015 | 0.0133 | 0.6692 | 0.5014 | |
2FI | 0.0218 | 0.0277 | 0.8552 | 0.8037 | |
Quadratic | 0.0027 | 0.1906 | 0.9836 | 0.9168 | Suggested |
Cubic | 0.1906 | 0.9946 | Aliased | ||
TTC | |||||
Linear | 0.0075 | 0.0818 | 0.5531 | 0.3378 | |
2FI | 0.3925 | 0.0782 | 0.5686 | 0.0651 | |
Quadratic | 0.0009 | 0.7449 | 0.9691 | 0.9141 | Suggested |
Cubic | 0.7449 | 0.9538 | Aliased | ||
DPPH | |||||
Linear | 0.0029 | 0.0052 | 0.626 | 0.4772 | |
2FI | 0.3752 | 0.005 | 0.6438 | 0.3643 | |
Quadratic | < 0.0001 | 0.1336 | 0.9896 | 0.9453 | Suggested |
Cubic | 0.1336 | 0.9976 | Aliased | ||
ABTS | |||||
Linear | 0.0195 | 0.0462 | 0.4637 | 0.3224 | |
2FI | 0.3711 | 0.0447 | 0.491 | 0.3963 | |
Quadratic | 0.0001 | 0.8749 | 0.9836 | 0.9666 | Suggested |
Cubic | 0.8749 | 0.9692 | Aliased |
Source | DF | TPC (mg GAE/g ds) | TFC (mg RE/g ds) | TTC (mg TAE/g ds) | DPPH (mM TE/g ds) | ABTS (mM TE/g ds) | |||||
|---|---|---|---|---|---|---|---|---|---|---|---|
CE | p-Value | CE | p-Value | CE | p-Value | CE | p-Value | CE | p-Value | ||
Model | 9 | 282.32 | < 0.0001*** | 61.72 | < 0.0001*** | 79.87 | 0.0002** | 4.99 | < 0.0001*** | 5.53 | < 0.0001*** |
(MP) | 1 | 20.63 | < 0.0001*** | 6.73 | < 0.0001*** | 4.85 | < 0.0001*** | 0.42 | < 0.0001*** | 0.46 | < 0.0001*** |
(ET) | 1 | 12.78 | < 0.0001*** | 3.71 | 0.0001** | 2.50 | 0.0014* | 0.23 | < 0.0001*** | 0.32 | < 0.0001*** |
(PS) | 1 | -11.38 | < 0.0001*** | -4.32 | < 0.0001*** | -3.96 | 0.0002** | -0.31 | < 0.0001*** | -0.21 | 0.0005** |
1 | 9.43 | 0.0012* | 4.21 | 0.0004** | -0.50 | 0.4101 | 0.21 | 0.0005** | 0.26 | 0.0011* | |
1 | 2.28 | 0.1715 | 4.37 | 0.0003** | 3.79 | 0.0010* | 0.20 | 0.0007** | 0.10 | 0.0465* | |
1 | 5.04 | 0.0168* | -0.69 | 0.2258 | -0.18 | 0.7659 | -0.04 | 0.2141 | 0.29 | 0.0006** | |
1 | -7.79 | 0.0034* | -2.87 | 0.0026* | 0.64 | 0.3173 | -0.03 | 0.3121 | -0.35 | 0.0003** | |
1 | -12.50 | 0.0004** | -2.96 | 0.0022* | -5.40 | 0.0002** | -0.37 | < 0.0001*** | -0.45 | < 0.0001*** | |
1 | -8.33 | 0.0025* | -1.70 | 0.0217* | -2.67 | 0.0058* | -0.29 | 0.0001** | -0.32 | 0.0004** | |
Residual | 5 | ||||||||||
Lack of fit | 3 | 0.0635 | 0.1906 | 0.7449 | 0.1336 | 0.8749 | |||||
SD | 2.86 | 0.99 | 1.11 | 0.05 | 0.08 | ||||||
CV % | 1.07 | 1.72 | 1.47 | 1.14 | 1.54 | ||||||
Adj- | 0.98 | 0.98 | 0.97 | 0.99 | 0.98 | ||||||
Pred- | 0.91 | 0.92 | 0.91 | 0.95 | 0.97 | ||||||
AP | 31.27 | 35.54 | 19.41 | 39.88 | 29.50 | ||||||
MP | Microwave Power |
ET | Extraction Time |
PS | Particle Size |
TPC | Total Phenolic Content |
TFC | Total Flavonoid Content |
TTC | Total Tannin Content |
DPPH | 1,1 Diphenyl 2 Picrylhydrazyl |
ABTS | 2,2 Azino bis (3 Ethylbenzothiazoline 6 Sulfonic Acid) |
| [1] | Zhang Y-J, Gan R-Y, Li S, Zhou Y, Li A-N, Xu D-P, et al., Antioxidant Phytochemicals for the Prevention and Treatment of Chronic Diseases. Molecules, 2015. 20(12): 21138-21156. |
| [2] | Raudone L, Savickiene N. Phytochemical Profiles of Plant Materials: From Extracts to Added-Value Ingredients. Plants, 2024. 13(7): 964. |
| [3] | Petcu CD, Tăpăloagă D, Mihai OD, Gheorghe-Irimia R-A, Negoiță C, Georgescu IM, et al., Harnessing Natural Antioxidants for Enhancing Food Shelf Life: Exploring Sources and Applications in the Food Industry. Foods, 2023. 12(17): 3176. |
| [4] | A dithya BS, Nayeem M, Sagar NA, Kumar S. Therapeutic Potentials of Jamun (Syzygium cumini) and Its Integration Into Modern Food Technologies: A Review. International Journal of Food Science, 2025. 2025(1): 8197889. |
| [5] | Wali AF, Alam A. The Effect of Different Extraction Methods on Antioxidant Capacity and Phytochemical Screening of Syzygium cumini Seeds. Free Radicals and Antioxidants, 2019. 9(1): 48-51. |
| [6] | Silva CC, Gomes CL, Danda LJ, Roberto AEM, Carvalho AMRD, Ximenes EC, et al., Optimized microwave-assisted extraction of polyphenols and tannins from Syzygium cumini (L.) Skeels leaves through an experimental design coupled to a desirability approach. Anais da Academia Brasileira de Ciências, 2021. 93(2): e20190632. |
| [7] | Rana GMM, Uddin MJ, Islam MT, Barmon J, Dey SS, Chandra Ghos B, et al., Solvent-free microwave extraction and hydrodistillation extraction of essential oils from Syzygium cumini leaves: Comparative analysis of chemical constituents, in vitro and in silico approaches. LWT, 2025. 228: 118074. |
| [8] | Melikoglu M. Microwave-assisted extraction: Recent advances in optimization, synergistic approaches, and applications for green chemistry. Sustainable Chemistry for Climate Action, 2025. 7: 100122. |
| [9] | Priego-Capote F. 6 - Solid–liquid extraction techniques. In: Lucena R, Cárdenas S, editors. Analytical Sample Preparation With Nano- and Other High-Performance Materials: Elsevier; 2021. p. 111-30. |
| [10] | Tchabo W, Ma Y, Kwaw E, Xiao L, Wu M, Maurice AT. Impact of extraction parameters and their optimization on the nutraceuticals and antioxidant properties of aqueous extract mulberry leaf. Int J Food Prop, 2018. 21(1): 717-732. |
| [11] | Antony A, Farid M. Effect of Temperatures on Polyphenols during Extraction. Applied Sciences, 2022. 12(4): 2107. |
| [12] | Lee CS, Binner E, Winkworth-Smith C, John R, Gomes R, Robinson J. Enhancing natural product extraction and mass transfer using selective microwave heating. Chemical Engineering Science, 2016. 149: 97-103. |
| [13] | Wang N, Zhu H, Wang M, Zhao S, Sun G, Li Z. Recent Advancements in Microwave-Assisted Extraction of Flavonoids: A Review. Food and Bioprocess Technology, 2025. 18(3): 2083-100. |
| [14] | Chan C-H, Lim J-J, Yusoff R, Ngoh G-C. A generalized energy-based kinetic model for microwave-assisted extraction of bioactive compounds from plants. Sep Purif Technol, 2015. 143: 152-160. |
| [15] | Reji M, Kumar R. Response surface methodology (RSM): An overview to analyze multivariate data. Indian J Microbiol Res, 2022. 9: 241-248. |
| [16] | Kishimoto N. Microwave-assisted extraction of phenolic compounds from olive by-products. Chemical Engineering Transactions, 2022. 91: 613-618. |
| [17] | Tchabo W, Ma Y, Engmann FN, Zhang H. Ultrasound-assisted enzymatic extraction (UAEE) of phytochemical compounds from mulberry (Morus nigra) must and optimization study using response surface methodology. Industrial Crops and Products, 2015. 63: 214-225. |
| [18] | Haile M, Kang WH. Antioxidant Activity, Total Polyphenol, Flavonoid and Tannin Contents of Fermented Green Coffee Beans with Selected Yeasts. Fermentation. 2019; 5(1): 29. |
| [19] | Tchabo W, Ma Y, Kwaw E, Zhang H, Li X, Afoakwah NA. Effects of Ultrasound, High Pressure, and Manosonication Processes on Phenolic Profile and Antioxidant Properties of a Sulfur Dioxide-Free Mulberry (Morus nigra) Wine. Food and Bioprocess Technology, 2017. 10(7), |
| [20] | Smucker BJ, Edwards DJ, Weese ML. Response surface models: To reduce or not to reduce? JQT, 2021. 53(2): 197-216. |
| [21] | Sai D, Nataraj K, Lakshmana R. Response surface methodology-a statistical tool for the optimization of responses. Global Journal of Addiction & Rehabilitation Medicine, 2023. 7(1): 555705. |
| [22] | Rapheal IA, Moki E, Muhammad A, Mohammed G, Gusauc LH. Optimization and characterization of bio-oil produced from rice husk using surface response methodology. Acta Chem Malaysia, 2021. 5(1): 10-17. |
| [23] | Wijaya CJ, Ismadji S, Aparamarta HW, Gunawan S. Statistically Optimum HKUST-1 Synthesized by Room Temperature Coordination Modulation Method for the Adsorption of Crystal Violet Dye. Molecules, 2021. 26(21): 6430. |
| [24] | Wu CFJ. A fresh look at effect aliasing and interactions: some new wine in old bottles. AnISM, 2018. 70(2): 249-68. |
| [25] | Alsaud N, Farid M. Insight into the Influence of Grinding on the Extraction Efficiency of Selected Bioactive Compounds from Various Plant Leaves. Applied Sciences, 2020. 10(18): 6362. |
| [26] | Moys MH. Grinding to nano-sizes: Effect of media size and slurry viscosity. Miner Eng, 2015. 74: 64-67. |
| [27] | Aquino G, Basilicata MG, Crescenzi C, Vestuto V, Salviati E, Cerrato M, et al., Optimization of microwave-assisted extraction of antioxidant compounds from spring onion leaves using Box–Behnken design. Scientific Reports, 2023. 13(1): 14923. |
| [28] | Xue Y, Le Bourvellec C, Renard CMGC, Zhao L, Wang K, Hu Z, et al., Food component interactions: a hitchhiker's guide. Food Innovation and Advances, 2025. 4(3): 304-20. |
| [29] | lvarez Viñas M, Sanz V, Rodríguez Seoane P, López Hortas L, Flórez Fernández N, Dolores Torres M, et al. Microwave-Assisted Extraction (MAE). Green Extraction Techniques in Food Analysis: Bentham Science Publishers; 2023. |
| [30] | Chaves JO, de Souza MC, da Silva LC, Lachos-Perez D, Torres-Mayanga PC, Machado APdF, et al., Extraction of Flavonoids From Natural Sources Using Modern Techniques. Frontiers in Chemistry, 2020. Volume 8 - 2020. |
| [31] | Gao Y, Xia W, Shao P, Wu W, Chen H, Fang X, et al., Impact of thermal processing on dietary flavonoids. Current Opinion in Food Science, 2022. 48: 100915. |
| [32] | Chan C-H, Yusoff R, Ngoh G-C. Assessment of Scale-Up Parameters of Microwave-Assisted Extraction via the Extraction of Flavonoids from Cocoa Leaves. Chemical Engineering & Technology, 2015. 38(3): 489-496. |
| [33] | Ben Aziz M, Moutaoikil M, Zeng L, mouhaddach A, Boudboud A, Hajji L, et al., Review on oenological tannins: conventional and emergent extraction techniques, and characterization. Journal of Food Measurement and Characterization, 2024. 18(6): 4528-4544. |
| [34] | Pirozzi A, Donsì F. Impact of High-Pressure Homogenization on Enhancing the Extractability of Phytochemicals from Agri-Food Residues. Molecules, 2023. 28(15): 5657. |
| [35] | Picariello L, Rinaldi A, Forino M, Errichiello F, Moio L, Gambuti A. Effect of Different Enological Tannins on Oxygen Consumption, Phenolic Compounds, Color and Astringency Evolution of Aglianico Wine. Molecules, 2020. 25(20): 4607. |
| [36] | Tanaka T. Mechanisms underlying the dynamic changes in tannins associated with food processing and plant growth. Journal of Natural Medicines, 2025. 79(5): 967-985. |
| [37] | Chan C-H, Yeoh HK, Yusoff R, Ngoh GC. A first-principles model for plant cell rupture in microwave-assisted extraction of bioactive compounds. J Food Eng, 2016. 188: 98-107. |
| [38] | Gu C, Howell K, Dunshea FR, Suleria HAR. LC-ESI-QTOF/MS Characterisation of Phenolic Acids and Flavonoids in Polyphenol-Rich Fruits and Vegetables and Their Potential Antioxidant Activities. Antioxidants, 2019. 8(9): 405. |
| [39] | Yu M, Gouvinhas I, Rocha J, Barros AIRNA. Phytochemical and antioxidant analysis of medicinal and food plants towards bioactive food and pharmaceutical resources. Scientific Reports, 2021. 11(1): 10041. |
| [40] | Michalaki A, Grintzalis K. A Multiparametric Protocol for the Detailed Phytochemical and Antioxidant Characterisation of Plant Extracts. Methods and Protocols, 2023. 6(2): 40. |
| [41] | Dreisewerd B, Merz J, Schembecker G. Determining the solute–solid interactions in phytoextraction. Chemical Engineering Science, 2015. 134: 287-296. |
| [42] | Lomovskiy I, Makeeva L, Podgorbunskikh E, Lomovsky O. The Influence of Particle Size and Crystallinity of Plant Materials on the Diffusion Constant for Model Extraction. Processes, 2020. 8(11): 1348. |
| [43] | Yan L, Zhang Y, Yan H, Fan Y, Liu X, Ma C, et al., Molecular Characterization of Soluble Components in the Lignite by Sequential Solvent Extraction via Continuously Reducing Particle Size. ACS Omega, 2020. 5(19): 11075-1183. |
| [44] | Costantini M, Summo C, Centrone M, Rybicka I, D’Agostino M, Annicchiarico P, et al., Macro- and Micro-Nutrient Composition and Antioxidant Activity of Chickpea and Pea Accessions. Polish Journal of Food and Nutrition Sciences, 2021. 71(2): 177-185. |
| [45] | Gil-Martín E, Forbes-Hernández T, Romero A, Cianciosi D, Giampieri F, Battino M. Influence of the extraction method on the recovery of bioactive phenolic compounds from food industry by-products. Food Chem, 2022. 378: 131918. |
| [46] | Jovanović A, Skrt M, Petrović P, Janković-Častvan I, Zdunić G, Šavikin K, et al., Ethanol Thymus serpyllum extracts: Evaluation of extraction conditions via total polyphenol content and radical scavenging activity. Lekovite sirovine, 2019. 39: 23-9. |
| [47] | Hitayezu E, Kang Y-H. Effect of particle size on the physicochemical and morphological properties of Hypsizygus marmoreus mushroom powder and its hot-water extracts. Korean Journal of Food Preservation, 2021. 28(4): 504-549. |
| [48] | Ling JKU, Sam JH, Jeevanandam J, Chan YS, Nandong J. Thermal Degradation of Antioxidant Compounds: Effects of Parameters, Thermal Degradation Kinetics, and Formulation Strategies. Food and Bioprocess Technology, 2022. 15(9): 1919-1935. |
| [49] | Hobbi P, Okoro OV, Delporte C, Alimoradi H, Podstawczyk D, Nie L, et al., Kinetic modelling of the solid–liquid extraction process of polyphenolic compounds from apple pomace: influence of solvent composition and temperature. Bioresources and Bioprocessing, 2021. 8(1): 114. |
| [50] | Boateng ID. Application of Graphical Optimization, Desirability, and Multiple Response Functions in the Extraction of Food Bioactive Compounds. Food Engineering Reviews, 2023. 15(2): 309-328. |
| [51] | Manzanilla-Valdez ML, Ma Z, Mondor M, Hernández-Álvarez AJ. Decoding the Duality of Antinutrients: Assessing the Impact of Protein Extraction Methods on Plant-Based Protein Sources. Journal of Agricultural and Food Chemistry, 2024. 72(22): 12319-12339. |
| [52] | Nagy B, Simándi B, Dezső András C. Characterization of packed beds of plant materials processed by supercritical fluid extraction. J Food Eng, 2008. 88(1): 104-113. |
APA Style
Tchabo, W., Yadang, G., Edikou, S. U. K., Kaba, I., Kouyaté, S., et al. (2026). Process Optimization of Microwave-assisted Aqueous Extraction for Phytochemicals and Antioxidant Activity of Syzygium Cumini. Journal of Food and Nutrition Sciences, 14(1), 53-67. https://doi.org/10.11648/j.jfns.20261401.15
ACS Style
Tchabo, W.; Yadang, G.; Edikou, S. U. K.; Kaba, I.; Kouyaté, S., et al. Process Optimization of Microwave-assisted Aqueous Extraction for Phytochemicals and Antioxidant Activity of Syzygium Cumini. J. Food Nutr. Sci. 2026, 14(1), 53-67. doi: 10.11648/j.jfns.20261401.15
AMA Style
Tchabo W, Yadang G, Edikou SUK, Kaba I, Kouyaté S, et al. Process Optimization of Microwave-assisted Aqueous Extraction for Phytochemicals and Antioxidant Activity of Syzygium Cumini. J Food Nutr Sci. 2026;14(1):53-67. doi: 10.11648/j.jfns.20261401.15
@article{10.11648/j.jfns.20261401.15,
  author = {William Tchabo and Germaine Yadang and Spéro Ulrich Koba Edikou and Ibrahima Kaba and Sékou Kouyaté and Durand Dah-Nouvlessounon and Joseph Dossou},
  title = {Process Optimization of Microwave-assisted Aqueous Extraction for Phytochemicals and Antioxidant Activity of Syzygium Cumini},
  journal = {Journal of Food and Nutrition Sciences},
  volume = {14},
  number = {1},
  pages = {53-67},
  doi = {10.11648/j.jfns.20261401.15},
  url = {https://doi.org/10.11648/j.jfns.20261401.15},
  eprint = {https://article.sciencepublishinggroup.com/pdf/10.11648.j.jfns.20261401.15},
  abstract = {This study optimized microwave assisted aqueous extraction of phytochemicals from Syzygium cumini leaf powder using water as solvent. Response surface methodology with a three factor Box Behnken design was used to quantify the effects of microwave power, extraction time, and particle size. Factor ranges were 360 - 900 W, 8 - 20 min, and 100 - 500 µm. Microwave irradiation was applied in pulsed mode to limit boiling. Process performance was evaluated using total phenolic content, total flavonoid content, total tannin content, and antioxidant activity measured by DPPH and ABTS assays. Numerical optimization predicted an optimum at 900 W, 18.94 min, and 276.54 µm. At these conditions, predicted responses were 305.44 mg GAE/g ds for total phenolics, 70.12 mg RE/g ds for total flavonoids, and 83.35 mg TAE/g ds for total tannins. Predicted antioxidant activities were 5.51 mM TE/g ds for DPPH and 5.78 mM TE/g ds for ABTS. Experimental validation was conducted at the nearest practical settings of 900 W, 20 min, and 273 µm. Measured values were 305.55 ± 0.07 mg GAE/g ds, 70.54 ± 0.05 mg RE/g ds, and 81.99 ± 0.03 mg TAE/g ds for total phenolics, total flavonoids, and total tannins, respectively. DPPH and ABTS reached 5.47 ± 0.03 and 5.74 ± 0.04 mM TE/g ds, respectively. The close agreement between predicted and measured responses supports the use of RSM to define an implementable operating window for aqueous microwave extraction of Syzygium cumini leaves.},
 year = {2026}
}
TY  - JOUR
T1  - Process Optimization of Microwave-assisted Aqueous Extraction for Phytochemicals and Antioxidant Activity of Syzygium Cumini
AU  - William Tchabo
AU  - Germaine Yadang
AU  - Spéro Ulrich Koba Edikou
AU  - Ibrahima Kaba
AU  - Sékou Kouyaté
AU  - Durand Dah-Nouvlessounon
AU  - Joseph Dossou
Y1  - 2026/02/02
PY  - 2026
N1  - https://doi.org/10.11648/j.jfns.20261401.15
DO  - 10.11648/j.jfns.20261401.15
T2  - Journal of Food and Nutrition Sciences
JF  - Journal of Food and Nutrition Sciences
JO  - Journal of Food and Nutrition Sciences
SP  - 53
EP  - 67
PB  - Science Publishing Group
SN  - 2330-7293
UR  - https://doi.org/10.11648/j.jfns.20261401.15
AB  - This study optimized microwave assisted aqueous extraction of phytochemicals from Syzygium cumini leaf powder using water as solvent. Response surface methodology with a three factor Box Behnken design was used to quantify the effects of microwave power, extraction time, and particle size. Factor ranges were 360 - 900 W, 8 - 20 min, and 100 - 500 µm. Microwave irradiation was applied in pulsed mode to limit boiling. Process performance was evaluated using total phenolic content, total flavonoid content, total tannin content, and antioxidant activity measured by DPPH and ABTS assays. Numerical optimization predicted an optimum at 900 W, 18.94 min, and 276.54 µm. At these conditions, predicted responses were 305.44 mg GAE/g ds for total phenolics, 70.12 mg RE/g ds for total flavonoids, and 83.35 mg TAE/g ds for total tannins. Predicted antioxidant activities were 5.51 mM TE/g ds for DPPH and 5.78 mM TE/g ds for ABTS. Experimental validation was conducted at the nearest practical settings of 900 W, 20 min, and 273 µm. Measured values were 305.55 ± 0.07 mg GAE/g ds, 70.54 ± 0.05 mg RE/g ds, and 81.99 ± 0.03 mg TAE/g ds for total phenolics, total flavonoids, and total tannins, respectively. DPPH and ABTS reached 5.47 ± 0.03 and 5.74 ± 0.04 mM TE/g ds, respectively. The close agreement between predicted and measured responses supports the use of RSM to define an implementable operating window for aqueous microwave extraction of Syzygium cumini leaves.
VL  - 14
IS  - 1
ER  -
Department of Food Science and Nutrition, National Advanced School of Agro-Industrial Sciences, Ngaoundere, Cameroon;Department of Technology and Control of Food Products, Higher Institute of Sciences and Veterinary Medicine of Dalaba, Dalaba, Guinea
Department of Food Science and Nutrition, National Advanced School of Agro-Industrial Sciences, Ngaoundere, Cameroon
Department of Technology and Control of Food Products, Higher Institute of Sciences and Veterinary Medicine of Dalaba, Dalaba, Guinea
Department of Technology and Control of Food Products, Higher Institute of Sciences and Veterinary Medicine of Dalaba, Dalaba, Guinea
Department of Technology and Control of Food Products, Higher Institute of Sciences and Veterinary Medicine of Dalaba, Dalaba, Guinea
Faculty of Sciences and Techniques, University of Abomey-Calavi, Cotonou, Benin
Faculty of Agronomic Sciences, University of Abomey-Calavi, Cotonou, Benin
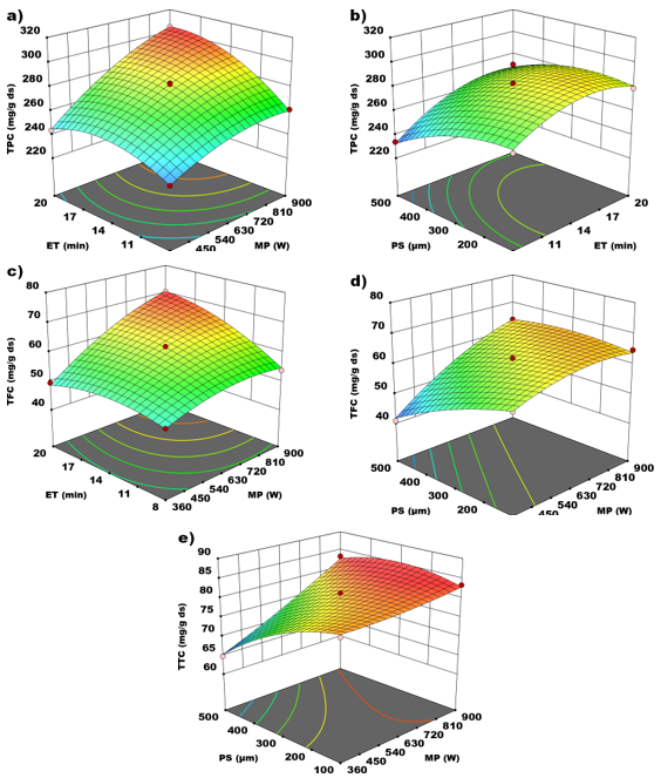
Figure 1.
3D surface plots for the interactive effect of microwave power, extraction time and particle size on the phytochemicals of Syzygium cumini leaf extract.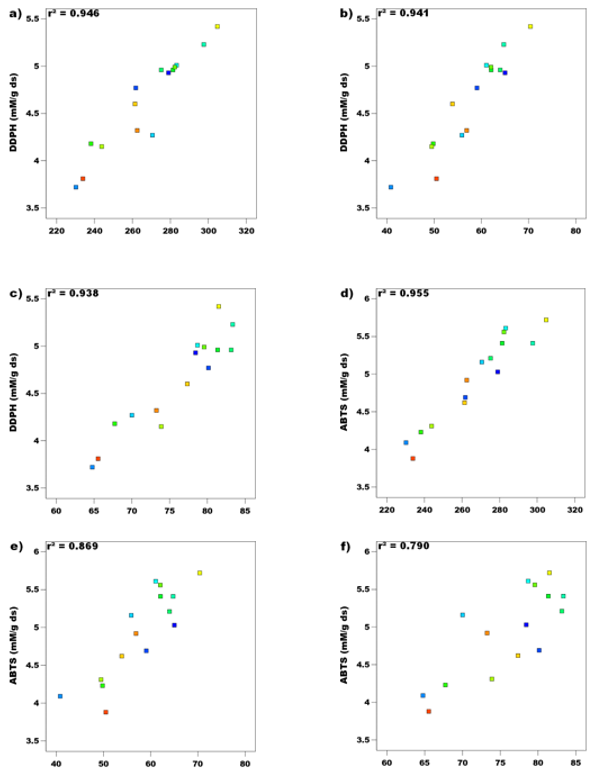
Figure 2.
Pairwise relationships between antioxidant activity and phytochemicals Syzygium cumini leaf extract.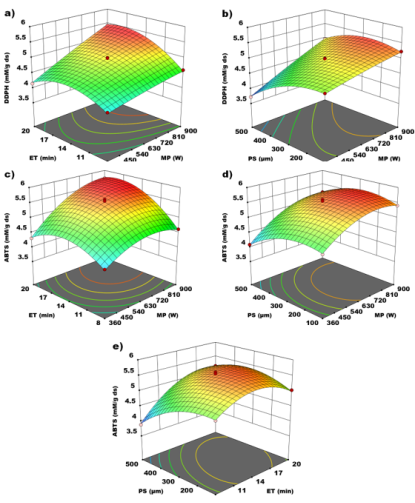
Figure 3.
3D surface plots for the interactive effect of microwave power, extraction time and particle size on the antioxidant activity of Syzygium cumini leaf extract.Information